30A Real Estate 2025 EOY Market Report: What Buyers & Sellers Need to Know

As someone who lives and breathes the 30A market every day, I can tell you this: the data from 2025 tells a very clear story. Whether you’re buying, selling, or simply watching the market, the numbers reveal how conditions shifted throughout the year. Below is a breakdown by area, showing how inventory, pricing, and buyer behavior evolved from January through December of 2025.
- Allison Freeman, Your Premier 30A Realtor

-
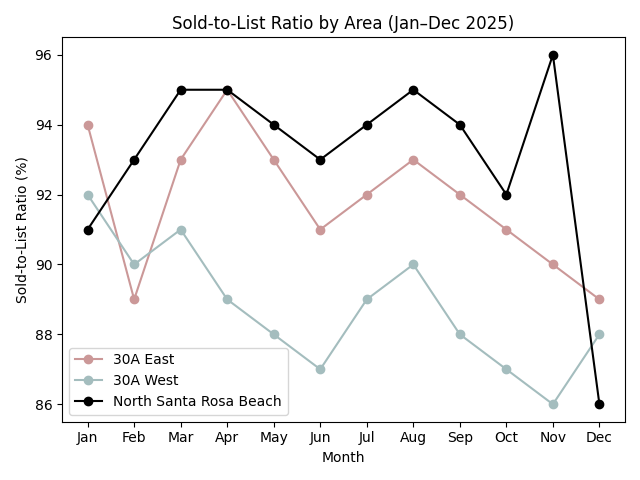
Sold to List Ratio 2025
Sold-to-list ratios stayed below 100 percent most of the year across all three areas, reinforcing buyer leverage and the need for accurate pricing.
-
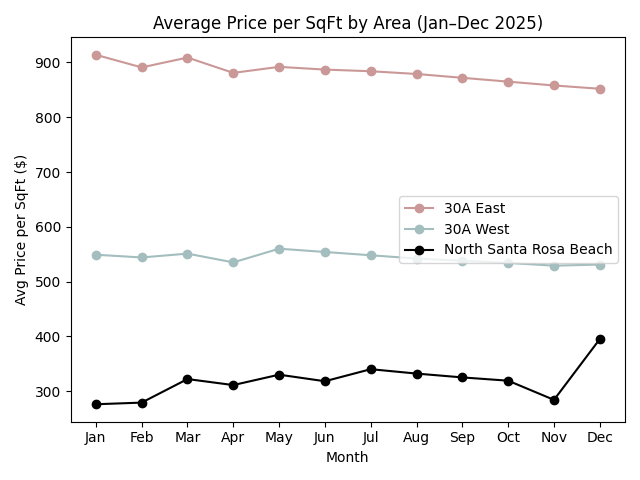
Avg Price per SqFT 2025
30A East consistently commands a premium, 30A West sits mid-range, and North Santa Rosa Beach remains the most accessible on a price-per-square-foot basis, with notable volatility late in the year.
-
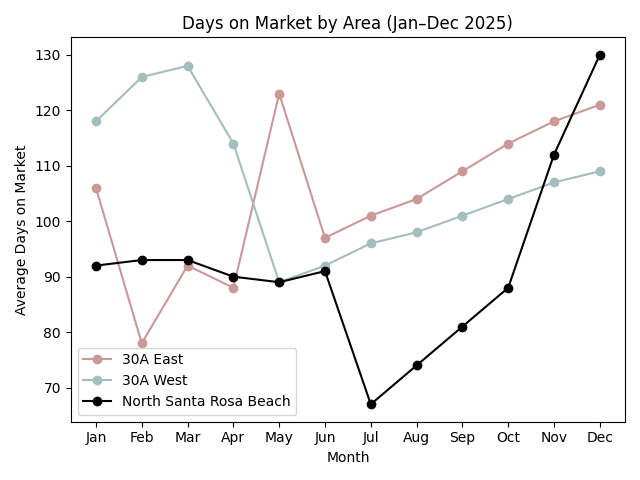
Days on Market 2025
Elevated Days on Market for much of 2025 highlights increased inventory and reinforces why pricing and presentation mattered so much for sellers.
2025 full-year market report
Full-Year Trends for 30A East, 30A West, and North Santa Rosa Beach
When I step back and look at the full January through December data, 2025 tells a consistent story across all three markets. Inventory stayed elevated for most of the year, buyers had leverage, and pricing required discipline. Some areas tightened in the second half, but the seller-friendly conditions of earlier cycles did not return in 2025.
This report is built for people who want the full-year view, not just a single month.
2025 at a Glance (What mattered most)
Primary indicator used: MOI (based on closed sales)
Sold-to-list ratios stayed in the low 90s overall
Some markets tightened in Q4, others stayed volatile
Months of Inventory (MOI) summary
| Market | Average MOI (2025) | Range (low to high) | Year-end direction |
|---|---|---|---|
| 30A East | 11.4 | 6.2 to 14.7 | Tightened materially into December (6.2) |
| 30A West | 13.9 | 8.1 to 19.1 | Volatile, then improved in December (8.1) |
| North Santa Rosa Beach | 8.6 | 5.5 to 13.6 | Mixed, ended December at 8.2 |
Sold-to-original list price ratios (negotiation leverage)
| Market | Average (2025) | Range (low to high) | What it signals |
|---|---|---|---|
| 30A East | 92.1% | 89% to 95% | Buyers negotiated consistently |
| 30A West | 89.6% | 86% to 93% | Strongest leverage for buyers |
| North Santa Rosa Beach | 92.3% | 86% to 96% | Negotiation windows varied by season |
If a seller wanted to “test” a number above market, the 2025 pattern was predictable: time on market, reductions, then negotiating anyway.
30A East: 2025 Full-Year Market Breakdown
2025 data snapshot
| Metric | 2025 average | 2025 range |
|---|---|---|
| Months of Inventory (Closed Sales) | 11.4 | 6.2 to 14.7 |
| Days on Market | 112 | 78 to 146 |
| Sold-to-List Ratio | 92.1% | 89% to 95% |
| Average Sold Price per Square Foot | $876 | $834 to $959 |
What changed during the year
- Headline story: gradual tightening into year-end.
- MOI peaked in May (14.7), then improved steadily, finishing December at 6.2.
- Still buyer-leaning, but meaningfully tighter than spring.
What it meant for buyers in 2025
- Leverage existed most of the year, but Q4 got more competitive for the best homes (well-priced, strong condition, strong location).
- Recommended approach: “target and move.” Focus on listings with time on market or pricing ahead of recent comps, then negotiate from evidence.
What it meant for sellers in 2025
- Correct pricing mattered more than ever. Buyer leverage shows up in the sold-to-list ratios.
- Staging and positioning still worked, but buyers expected clear value.
30A West: 2025 Full-Year Market Breakdown
2025 data snapshot
| Metric | 2025 average | 2025 range |
|---|---|---|
| Months of Inventory (Closed Sales) | 13.9 | 8.1 to 19.1 |
| Days on Market | 115 | 88 to 144 |
| Sold-to-List Ratio | 89.6% | 86% to 93% |
| Average Sold Price per Square Foot | $669 | $534 to $851 |
Note: one month’s Days on Market value did not reliably extract from the source PDF text, so the average reflects the other 11 months.
What changed during the year
- Most buyer-favorable overall based on inventory.
- MOI started very high in January (16.8), spiked again in November (19.1), then improved sharply in December (8.1).
- Volatility indicates buyers were active at times, but sellers still competed heavily for attention.
What it meant for buyers in 2025
- Clear “shop, compare, negotiate” advantage.
- Sold-to-list dipping into the mid-80s in some months shows discounting and concessions were real.
What it meant for sellers in 2025
To win, a property typically needed at least two of these three:
- Standout condition and presentation
- An undeniable price position
- A feature advantage buyers actually pay for (not just “nice to have”)
Otherwise, the property usually joined the competition pool.
North Santa Rosa Beach: 2025 Full-Year Market Breakdown
2025 data snapshot
| Metric | 2025 average | 2025 range |
|---|---|---|
| Months of Inventory (Closed Sales) | 8.6 | 5.5 to 13.6 |
| Days on Market | 100 | 67 to 130 |
| Sold-to-List Ratio | 92.3% | 86% to 96% |
| Average Sold Price per Square Foot | $356 | $276 to $448 |
What changed during the year
- Clear seasonality and sharp swings.
- Tightened to a low point in July (5.5 MOI), close to neutral conditions.
- Widened again and peaked in November (13.6), then ended December at 8.2.
What it meant for buyers in 2025
- Periodic windows where buyers had both leverage and value.
- Late-year sold-to-list low end of 86% suggests evidence-based negotiation was rewarded.
What it meant for sellers in 2025
- Pricing without support from recent comps tended to get punished by time and negotiating.
- To hold firm, the property needed to be the clear best option in its competitive set.
Cross-Market Comparison: What the full year actually showed
Clean takeaway
- Most buyer-favorable overall: 30A West (highest average MOI and lowest average sold-to-list ratio)
- Most improved into year-end: 30A East (tightened meaningfully by December)
- Most variable: North Santa Rosa Beach (tight summer, wider again in late fall)
Why this matters
When inventory is elevated, the market rewards pricing discipline and presentation. When inventory tightens, it typically tightens first for the best homes, not the entire market at once.
What I advised in 2025 (and still advise heading into 2026)
For buyers
- Use inventory as your leverage meter. When MOI is consistently above 6, negotiate based on evidence.
- Separate “pretty” from “priced right.” In a buyer market, both matter. Pretty alone does not protect price.
- Target listing fatigue. Time on market often creates the best opportunities.
For sellers
- Price to the market you are in. Sold-to-list ratios in the low 90s indicate buyers negotiated.
- Presentation is not optional. In 2025, buyers had choices. Under-prepared homes had a harder path.
- Aim for best value, not highest number. If you are not the best value, you are asking buyers to overpay.
2026 Outlook (Data-grounded, no hype)
- If inventory stays elevated, buyers keep leverage and sellers must compete.
- If inventory tightens further (especially in 30A East), the best homes will see more competition first, not the entire market at once.
- The most likely dynamic remains a split market: standout homes move, average homes negotiate.
I can break down trends by price band, property type, and micro-area so you can make decisions with cleaner comps and better context. Request a custom market review.
2025 Market Stats at a Glance
| Area | Q1 Avg. Sold Price | Q2 Avg. Sold Price | Q3 Avg. Sold Price | Q4 Avg. Sold Price | Quarterly Trend |
|---|---|---|---|---|---|
| 30A East | $2.32M | $2.21M | $2.18M | $2.15M | ↓ Gradual Softening |
| 30A West | $1.46M | $1.18M | $1.12M | $1.19M | ↕ Highly Volatile |
| North Santa Rosa Beach | $612K | $785K | $842K | $907K | ↑ Net Rising, Volatile |
Quarterly averages are weighted by monthly closed sales volume to reduce distortion from low-transaction months.
-
In 2025, the data supports that it was buyer-favorable most of the year across 30A East, 30A West, and North Santa Rosa Beach, based primarily on Months of Inventory and sold-to-list ratios.
-
30A West showed the most consistent leverage for buyers based on the highest average Months of Inventory and the lowest average sold-to-list ratio.
-
Yes. Months of Inventory in 30A East tightened significantly into December, which is a measurable shift toward a more balanced environment, though still not a strong seller market.
-
On average in 2025, yes. Across the three areas, average sold-to-original list price ratios were in the low 90s, and 30A West averaged below 90%.
-
Days on Market averaged around 100 to 115 days depending on area, with meaningful month-to-month swings.