February 2026 30A Real Estate Market Report
Published March 2026
February 2026 Highlights:
Highlights
Sales volume surged across all three markets — 30A East led with 76 closings, up 38% year over year
30A West price trends flipped to Appreciating on both average and median sold price
North Santa Rosa Beach inventory tightened into neutral market territory
Price per square foot rose year over year in 30A West and North Santa Rosa Beach
Buyer's market conditions remain in place on 30A East and West, but absorption is accelerating fast
30A East
Months of Inventory (Closed Sales): 8.6 months ↓ 3.4% MoM | ↓ 39.4% YoY
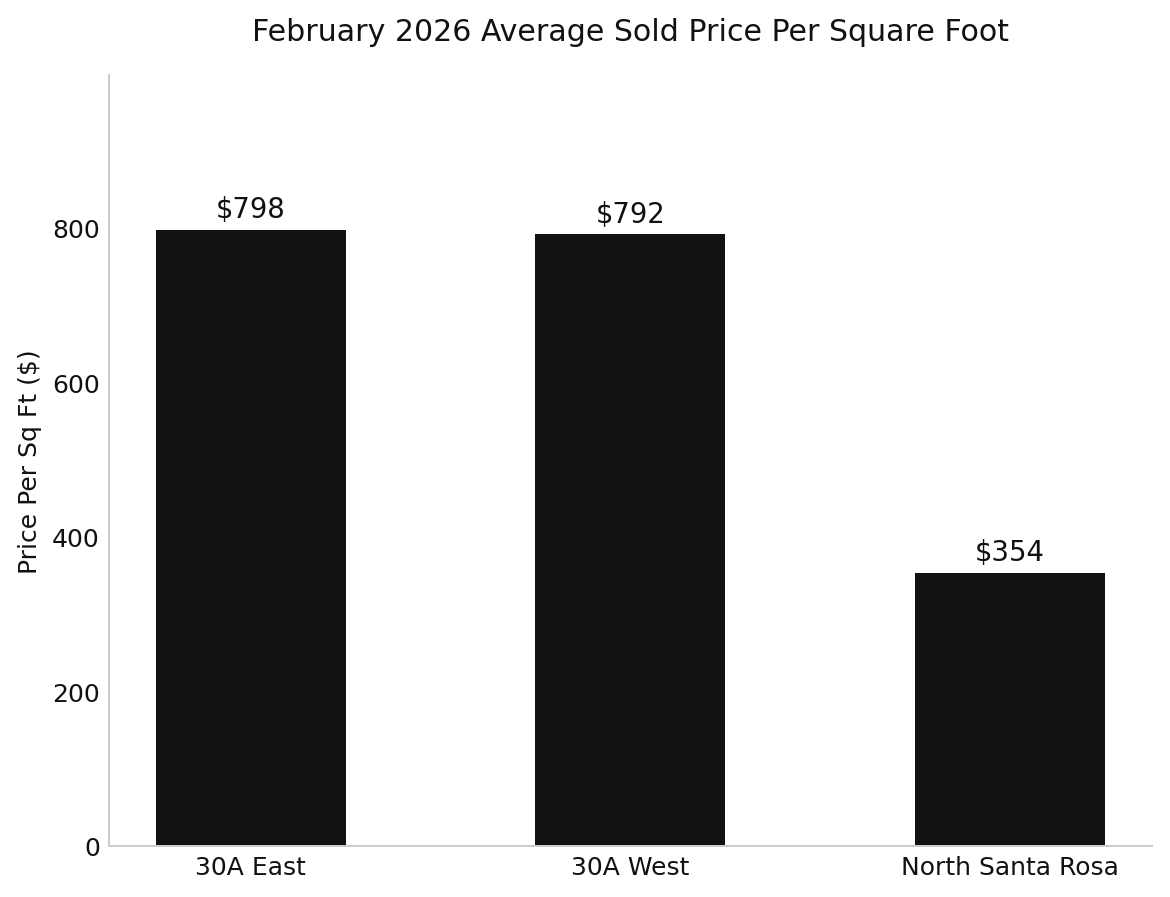
Average Price Per Sq Ft: $798 ↓ 17.3% MoM | ↓ 9.7% YoY
Average Sold Price: $1,974,000 ↓ 23.9% MoM | ↓ 17.1% YoY
Median Sold Price: $1,300,000 ↓ 9% MoM | ↓ 9.7% YoY
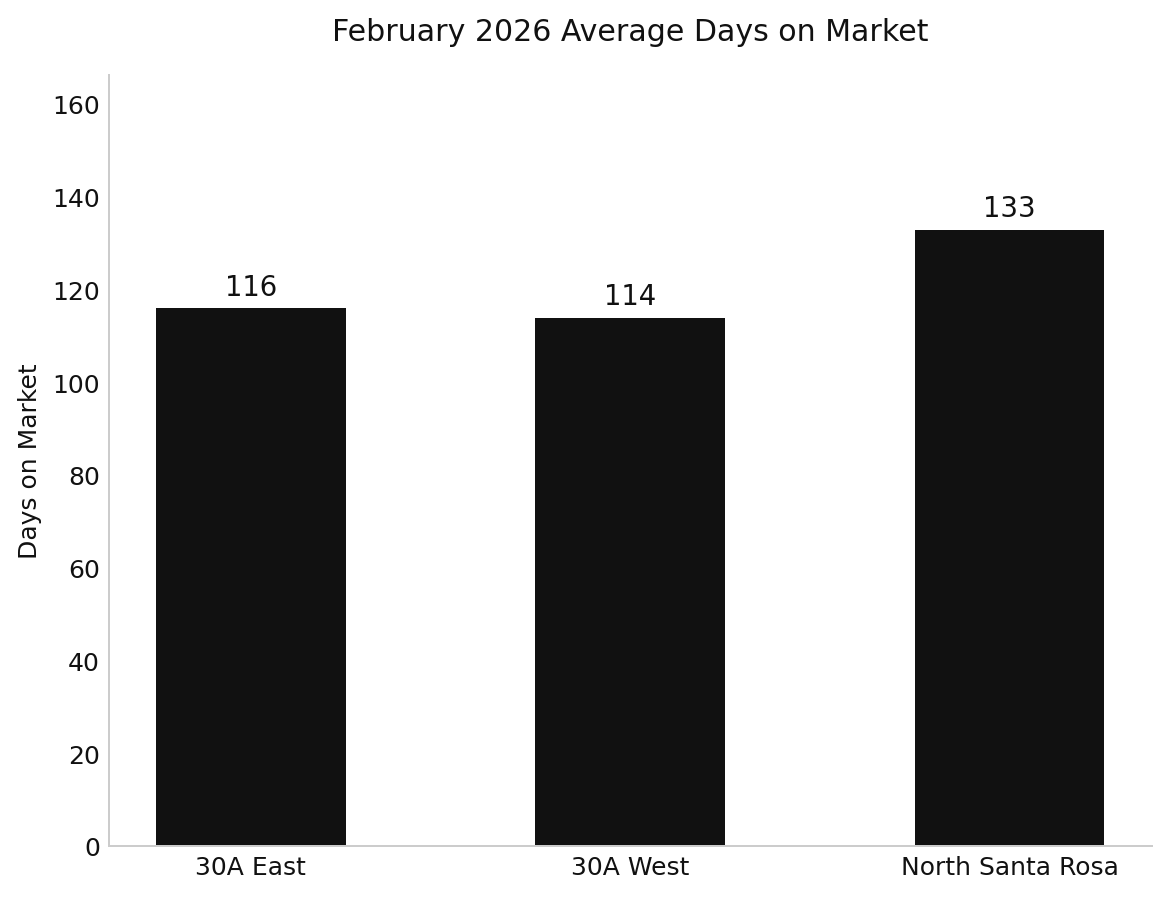
Average Days on Market: 116 days ↓ 4.9% MoM | ↑ 45% YoY
Sold to List Price Ratio: 95% ↑ 2.2% MoM | ↑ 4.4% YoY
What It Means: 30A East posted the highest sales volume of any submarket this month — 76 closed transactions, up 38.2% from a year ago. That number matters. Whatever the headline pricing metrics suggest, buyers are showing up and closing.
Average and median sold prices declined both month over month and year over year, and the 6-month trend on both is classified as Depreciating. But this market covers everything from $400K condos near Inlet Beach to $10M+ compounds in Alys Beach. When the mix shifts — fewer trophy closings in a given month — averages move dramatically without underlying values actually falling.
The sold-to-list ratio tells a cleaner story: 95% and Rising on a 6-month trend. Sellers are getting closer to their ask, not further away. That's not a depreciating market signal — that's a tightening one.
Days on market remain elevated at 116 days, but the 6-month DOM trend is Downward. Homes are moving faster than they were. The market is directionally improving for sellers even while buyers still hold leverage on individual negotiations.
This is a high-variance, deeply segmented market. Data requires context.
30A West
Months of Inventory (Closed Sales): 9.4 months ↓ 36% MoM | ↓ 42.7% YoY
Average Price Per Sq Ft: $792 ↑ 19.1% MoM | ↑ 10.9% YoY
Average Sold Price: $2,060,000 ↑ 4.3% MoM | ↑ 17.6% YoY
Median Sold Price: $1,483,000 ↑ 19.1% MoM | ↑ 34.8% YoY
Average Days on Market: 114 days ↓ 5% MoM | ↓ 8.1% YoY
Sold to List Price Ratio: 89% ↓ 3.3% MoM | ↓ 1.1% YoY
What It Means: 30A West had a February to notice. Sales doubled year over year. The 6-month trend on both average and median sold price is now Appreciating — a meaningful shift from where this submarket was sitting late last year.
Price per square foot came in at $792, up 10.9% from February 2025 and up 19.1% from January. The median sold price of $1,483,000 is up 34.8% year over year. These are not noise — they reflect real pricing momentum in communities like Seaside, WaterColor, and Grayton Beach where land scarcity and brand identity create durable demand.
Months of inventory dropped 42.7% from last year and 36% from last month. The market is absorbing inventory at a pace that's compressing supply faster than most observers expected this early in the season.
The sold-to-list ratio of 89% still gives buyers room to negotiate, and it should. But the directional read on 30A West has changed. Sellers who priced correctly in February got rewarded.
Buyers waiting for this market to soften further may be waiting into a headwind.
North Santa Rosa Beach
(North of Hwy 98, inland corridor)
Months of Inventory (Closed Sales): 5.9 months ↓ 19.1% MoM | ↓ 16.9% YoY
Average Price Per Sq Ft: $354 ↓ 6.1% MoM | ↑ 21.2% YoY
Average Sold Price: $764,000 ↓ 15.5% MoM | ↑ 32% YoY
Median Sold Price: $500,000 ↑ 13.6% MoM | ↓ 8.3% YoY
Average Days on Market: 133 days ↑ 0.8% MoM | ↑ 46.2% YoY
Sold to List Price Ratio: 91% ↓ 2.2% MoM | ↓ 1.1% YoY
What It Means: North Santa Rosa Beach crossed into neutral market territory in February, with 5.9 months of inventory — the tightest reading of the three submarkets and down nearly 17% from a year ago. Balanced markets sit between 3 and 6 months. This area is sitting right at the line.
Pricing is mixed in ways that require some patience to interpret. Average sold price jumped 32% year over year but fell 15.5% from January. Median is up 13.6% from last month but down 8.3% from last February. The 6-month trends on both are classified as Depreciating or Neutral. This is a wide-band market where sales mix drives month-to-month swings more than actual value changes.
What's consistent: price per square foot at $354 is up 21.2% year over year. And the sold-to-list ratio of 91% has remained Steady on a 6-month trend. Sellers are reliably accepting about 9% below ask. That's a predictable, stable environment.
Days on market at 133 is the highest of the three markets, and the 6-month trend is Upward. Buyers have time. But with inventory tightening meaningfully, that time may be shorter than it appears.
Allison's Advice for Buyers
Buyer's market conditions still apply on 30A East and West. Months of inventory remain above six in both areas. Negotiation is normal and expected.
But February's data introduces some important nuance. Absorption is accelerating. Sales are surging. And on 30A West, prices are trending up — not down.
Focus on:
Days on market and price reduction history
Sold-to-list ratios in the specific neighborhood, not just the submarket
Rental income potential and layout efficiency if buying as an investment
Condition relative to competing active inventory
The leverage window is real. It's also moving.
Allison's Advice for Sellers
Inventory is still elevated on 30A East and West. Buyers have options and they know it.
Most homes are closing between 89% and 95% of original list price depending on submarket. Sellers who enter aggressively tend to accumulate days, then reduce. Sellers who price precisely tend to close.
On 30A West specifically, the market dynamic has shifted enough that well-priced homes are moving with real momentum. If you've been waiting for the right window, February's data suggests it may be opening.
In North Santa Rosa Beach, the tightening inventory picture is quietly working in sellers' favor. Competition is increasing faster here than the headline numbers show.
Looking Ahead
Key indicators to watch heading into peak spring season:
Whether 30A West absorption continues to compress inventory below 9 months
Whether 30A East's rising sold-to-list ratio translates into stabilizing average prices
Whether North Santa Rosa Beach crosses fully into seller's market territory as inventory tightens
All three markets are moving in the same direction: toward balance. The speed varies by submarket. Strategy matters more than timing.
Want to Talk Strategy? Allison Freeman, 30A Realtor, can help you navigate this market confidently. Call or text 501.425.7656.