January 2026 30A Real Estate Market Report
January 2026 Highlights:
Highlights
Buyer’s market conditions continued across all tracked areas
Inventory remains elevated, though North Santa Rosa Beach moved closer to balance
Under contract activity increased meaningfully in all three submarkets
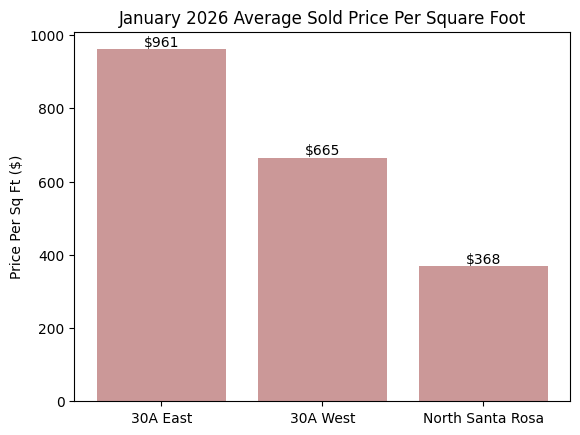
Price behavior was mixed, with price per square foot up year over year in every area
30A East
Months of Inventory (Closed Sales): 8.7 months
↑ 42.5% MoM | ↓ 23.1% YoYAverage Price Per Sq Ft: $961
↑ 14.7% MoM | ↑ 5.1% YoYAverage Sold Price: $2,593,000
↑ 21.2% MoM | ↑ 8.3% YoYMedian Sold Price: $1,457,000
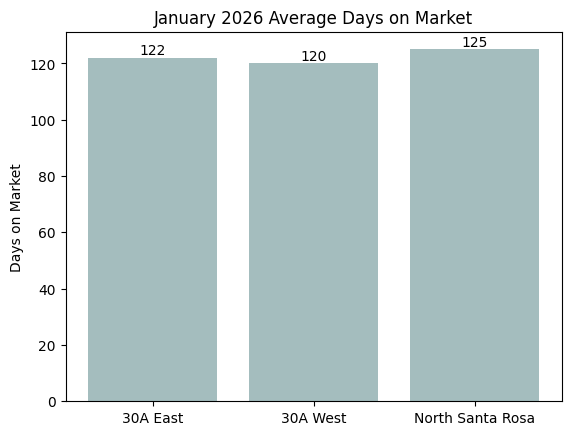
↑ 6% MoM | ↓ 1.9% YoYAverage Days on Market: 122 days
↑ 3.4% MoM | ↑ 15.1% YoYSold to List Price Ratio: 93%
↓ 1.1% MoM | ↓ 1.1% YoY
What It Means:
30A East remains in buyer’s market territory with nearly nine months of supply. Buyers have leverage, but the pricing data tells a more nuanced story.
Average sold price increased more than 21 percent month over month. Price per square foot rose year over year. That signals selective strength rather than broad appreciation.
Days on market remain elevated at 122 days. Homes are taking time to sell, and buyers are deliberate. Well positioned homes are moving. Overpriced homes are sitting.
This is a disciplined market, not a distressed one.
30A West
Months of Inventory (Closed Sales): 14.7 months
↑ 86% MoM | ↓ 12.5% YoYAverage Price Per Sq Ft: $665
↓ 3.3% MoM | ↑ 21.1% YoYAverage Sold Price: $1,976,000
↑ 14.3% MoM | ↑ 32.4% YoYMedian Sold Price: $1,245,000
↑ 0.6% MoM | ↑ 8.3% YoYAverage Days on Market: 120 days
↓ 13.7% MoM | ↑ 3.4% YoYSold to List Price Ratio: 92%
↑ 1.1% MoM | ↑ 5.7% YoY
What It Means:
30A West carries the heaviest inventory load along the corridor. Nearly fifteen months of supply firmly favors buyers.
At the same time, average sold price increased both month over month and year over year. Pending contracts jumped significantly from December, indicating buyers are stepping in when pricing aligns.
The key issue here is inventory volume. Sellers are competing against many alternatives. Pricing and presentation are decisive.
Buyers retain meaningful leverage, especially on homes that have been sitting.
North Santa Rosa Beach
Months of Inventory (Closed Sales): 6.8 months
↓ 12.8% MoM | ↓ 24.6% YoYAverage Price Per Sq Ft: $368
↓ 5.9% MoM | ↑ 33.3% YoYAverage Sold Price: $874,000
↓ 0.8% MoM | ↑ 97.3% YoYMedian Sold Price: $440,000
↓ 15.9% MoM | ↓ 1.1% YoYAverage Days on Market: 125 days
↓ 1.6% MoM | ↑ 40.4% YoYSold to List Price Ratio: 93%
↑ 8.1% MoM | ↓ 1.1% YoY
What It Means:
North Santa Rosa Beach is tightening relative to the other submarkets. Inventory declined month over month and year over year.
Median pricing declined month over month, likely reflecting sales mix. Price per square foot remains significantly higher year over year.
This segment continues to offer relative affordability with improving absorption.
Allison’s Advice for Buyers
Buyers retain leverage across all three markets.
Months of inventory exceed balanced conditions in each segment. Sold to list ratios remain below 95 percent, indicating negotiation is standard.
However, price per square foot is up year over year everywhere. That indicates stability underneath the headline inventory numbers.
Focus on:
• Extended days on market
• Price reduction history
• Rental fundamentals and layout
• Condition relative to competing inventory
Well positioned homes are still moving. Hesitation on the right property can cost opportunity.
Allison’s Advice for Sellers
Inventory remains elevated, particularly in 30A West.
Negotiation should be expected. Most homes are closing between 92 and 93 percent of original list price.
Initial pricing discipline is critical. Sellers entering the market ambitiously often accumulate days and then chase price reductions.
Presentation and positioning matter more than ever in a market where buyers have alternatives.
Homes priced correctly and prepared properly are still selling. Sellers anchored to prior cycle highs are waiting.
Looking Ahead
Key indicators to monitor as we move into late Q1:
• Whether month-over-month inventory continues compressing in North Santa Rosa Beach
• Whether 30A West absorption improves
• Whether 30A East price per square foot sustains near current levels
This remains a selective, leverage driven market. Strategy and data matter more than timing.
Want to Talk Strategy? Allison Freeman, 30A Realtor, can help you navigate this market confidently. Call me at 501.425.7656!