December 2025 30A Real Estate Market Report
December 2025 Highlights:
Highlights
Buyer’s market conditions continued across all tracked areas
Inventory remains elevated, though 30A East moved closer to balance
Sales activity improved month over month in all submarkets
Price per square foot remained down year over year across the board
30A East
Months of Inventory (Closed Sales): 6.2 months
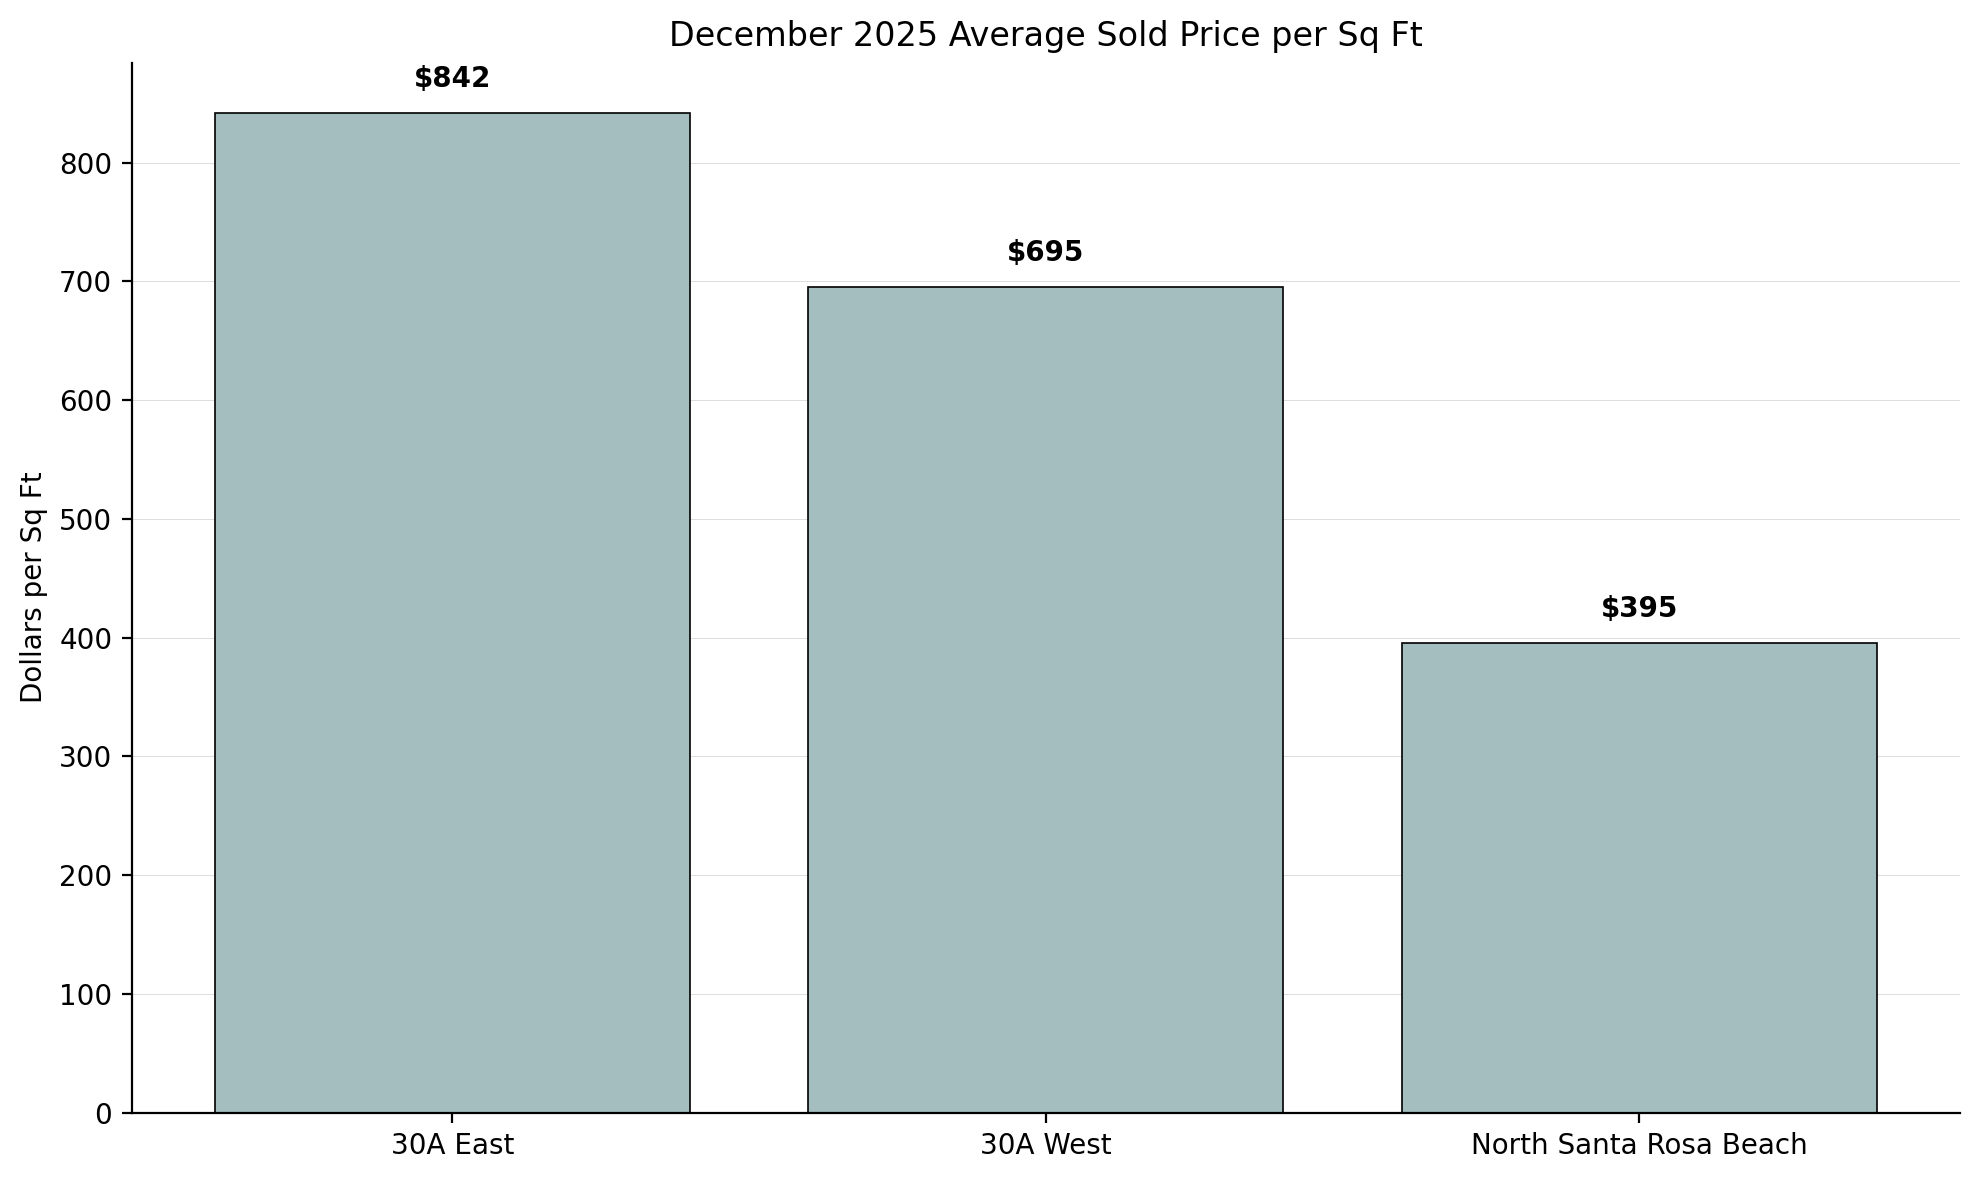
Average Price Per Sq Ft: $842
Average Sold Price: $2,144,000
Median Sold Price: $1,585,000
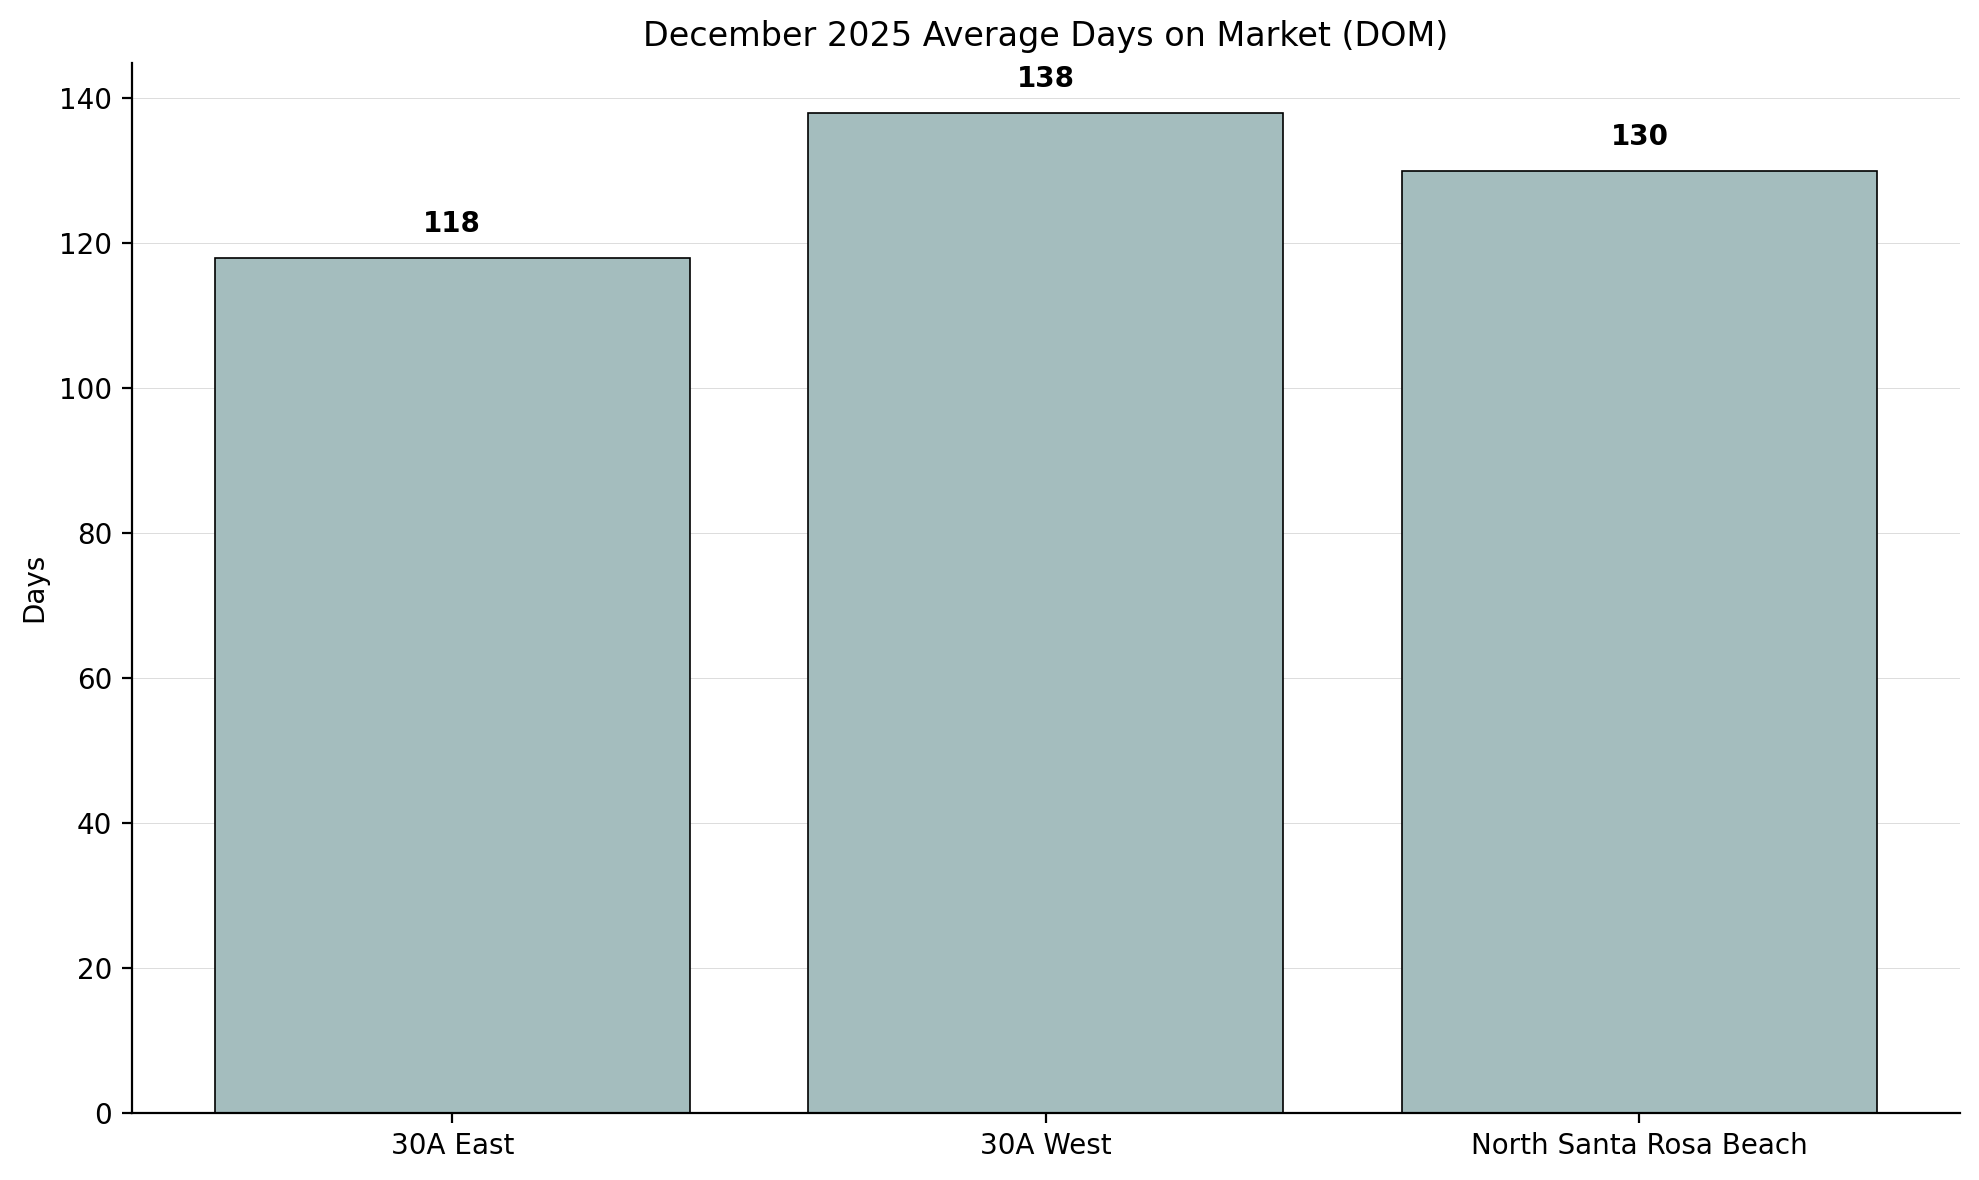
Average Days on Market: 118 days
Sold to List Price Ratio: 93%
What It Means:
Sales activity picked up meaningfully in December, helping bring months of inventory down from November levels and improving days on market. That said, pricing remains under pressure. Both average and median sold prices declined year over year, and price per square foot continues to trend lower. This signals healthier deal flow, not appreciation. Buyers are active, but they are still price sensitive and disciplined.
30A West
Months of Inventory (Closed Sales): 8.1 months
Average Price Per Sq Ft: $695
Average Sold Price: $1,691,000
Median Sold Price: $1,250,000
Average Days on Market: 138 days
Sold to List Price Ratio: 92%
What It Means:
30A West saw a strong rebound in closings compared to November, but inventory remains firmly in buyer’s market territory. Days on market improved slightly, though homes are still taking a long time to sell. The jump in average price per square foot should be viewed cautiously, as December’s sales mix skewed higher than prior months. Overall, sellers continue to face pricing pressure, and buyers retain leverage.
North Santa Rosa Beach
Months of Inventory (Closed Sales): 8.2 months
Average Price Per Sq Ft: $395
Average Sold Price: $742,000
Median Sold Price: $640,000
Average Days on Market: 130 days
Sold to List Price Ratio: 86%
What It Means:
This area remains the most buyer-friendly segment of the market. While closed sales increased month over month, days on market rose sharply and sellers are conceding the most during negotiations. The increase in price per square foot reflects the types of homes that sold in December rather than a broad pricing shift. Buyers here are clearly setting the terms, and sellers must compete aggressively to secure a contract.
Allison’s Advice for Buyers
December reinforced what we have seen for much of the second half of the year. Buyers continue to have leverage across 30A, with inventory levels well above balanced conditions in most areas and pricing still adjusting. Even in 30A East, where months of supply improved, buyers are negotiating successfully and closing below original list price.
That said, activity is picking up. More homes are trading hands, which means the best properties are still finding buyers. Homes that are well located, updated, and priced correctly continue to stand out, even in a slower market. Buyers who hesitate too long on the right opportunity risk missing it, especially as we move closer to spring.
Pay attention to days on market and price history. Homes that have lingered typically offer the most flexibility, while newer listings priced correctly are still attracting attention. Price per square foot trends show values remain softer year over year, which supports a disciplined, data driven approach.
If short-term rental potential is part of your plan, details matter. Pool usability, proximity to beach access, layout, and overall visual appeal continue to separate strong performers from average ones. Not every home will benefit equally when demand increases.
Bottom line: Buyers still have leverage, choice, and time. But the best homes remain competitive, even in a buyer’s market.
Allison’s Advice for Sellers
December showed that the market will still reward sellers who are realistic and strategic. Sales activity improved, but pricing power did not return. Buyers are active, informed, and selective, and they are quick to pass on homes that feel overpriced or underprepared.
Pricing remains the most important decision. Homes that are priced correctly from the start are selling faster and with fewer concessions than those that enter the market ambitiously. Waiting to adjust pricing after weeks or months on the market often results in weaker outcomes.
Presentation continues to matter. Clean, updated, turnkey homes perform better, even when inventory is high. Small condition issues, dated finishes, or weak furnishings stand out quickly when buyers have abundant options.
Negotiation should be expected. Sold-to-list price ratios remain below 95 percent in every area, and in some segments are much lower. Sellers who resist that reality often extend their days on market unnecessarily.
Bottom line: Homes that are priced right, prepared properly, and positioned clearly are still selling. Sellers anchored to past pricing are waiting.
Looking Ahead
As we move into early 2026, we are watching contract-to-close conversion closely. Strong pending activity only matters if deals actually close, and that will give us a clearer signal of buyer confidence heading into spring.
We are also monitoring pricing behavior after the holidays. Sellers who remain on the market into late winter may become more flexible, especially those who have already reduced multiple times.
Early Q1 activity will be telling. A quicker-than-normal return of serious buyers would suggest pent-up demand is still present, just cautious.
The opportunity window remains open. Success in this market continues to come down to strategy, preparation, and data driven decision-making.
Want to Talk Strategy? Allison Freeman, 30A Realtor, can help you navigate this market confidently. Call me at 501.425.7656!