November 2025 30A Real Estate Market Report
November 2025 Highlights:
Highlights
Buyer’s market across all tracked areas
Inventory remains high with months of supply well above balanced levels
Sold prices showed short-term month over month volatility
Price per square foot declined year over year in every submarket
Negotiation power continues to favor buyers
30A East
Months of Inventory (Closed Sales): 9.6 months
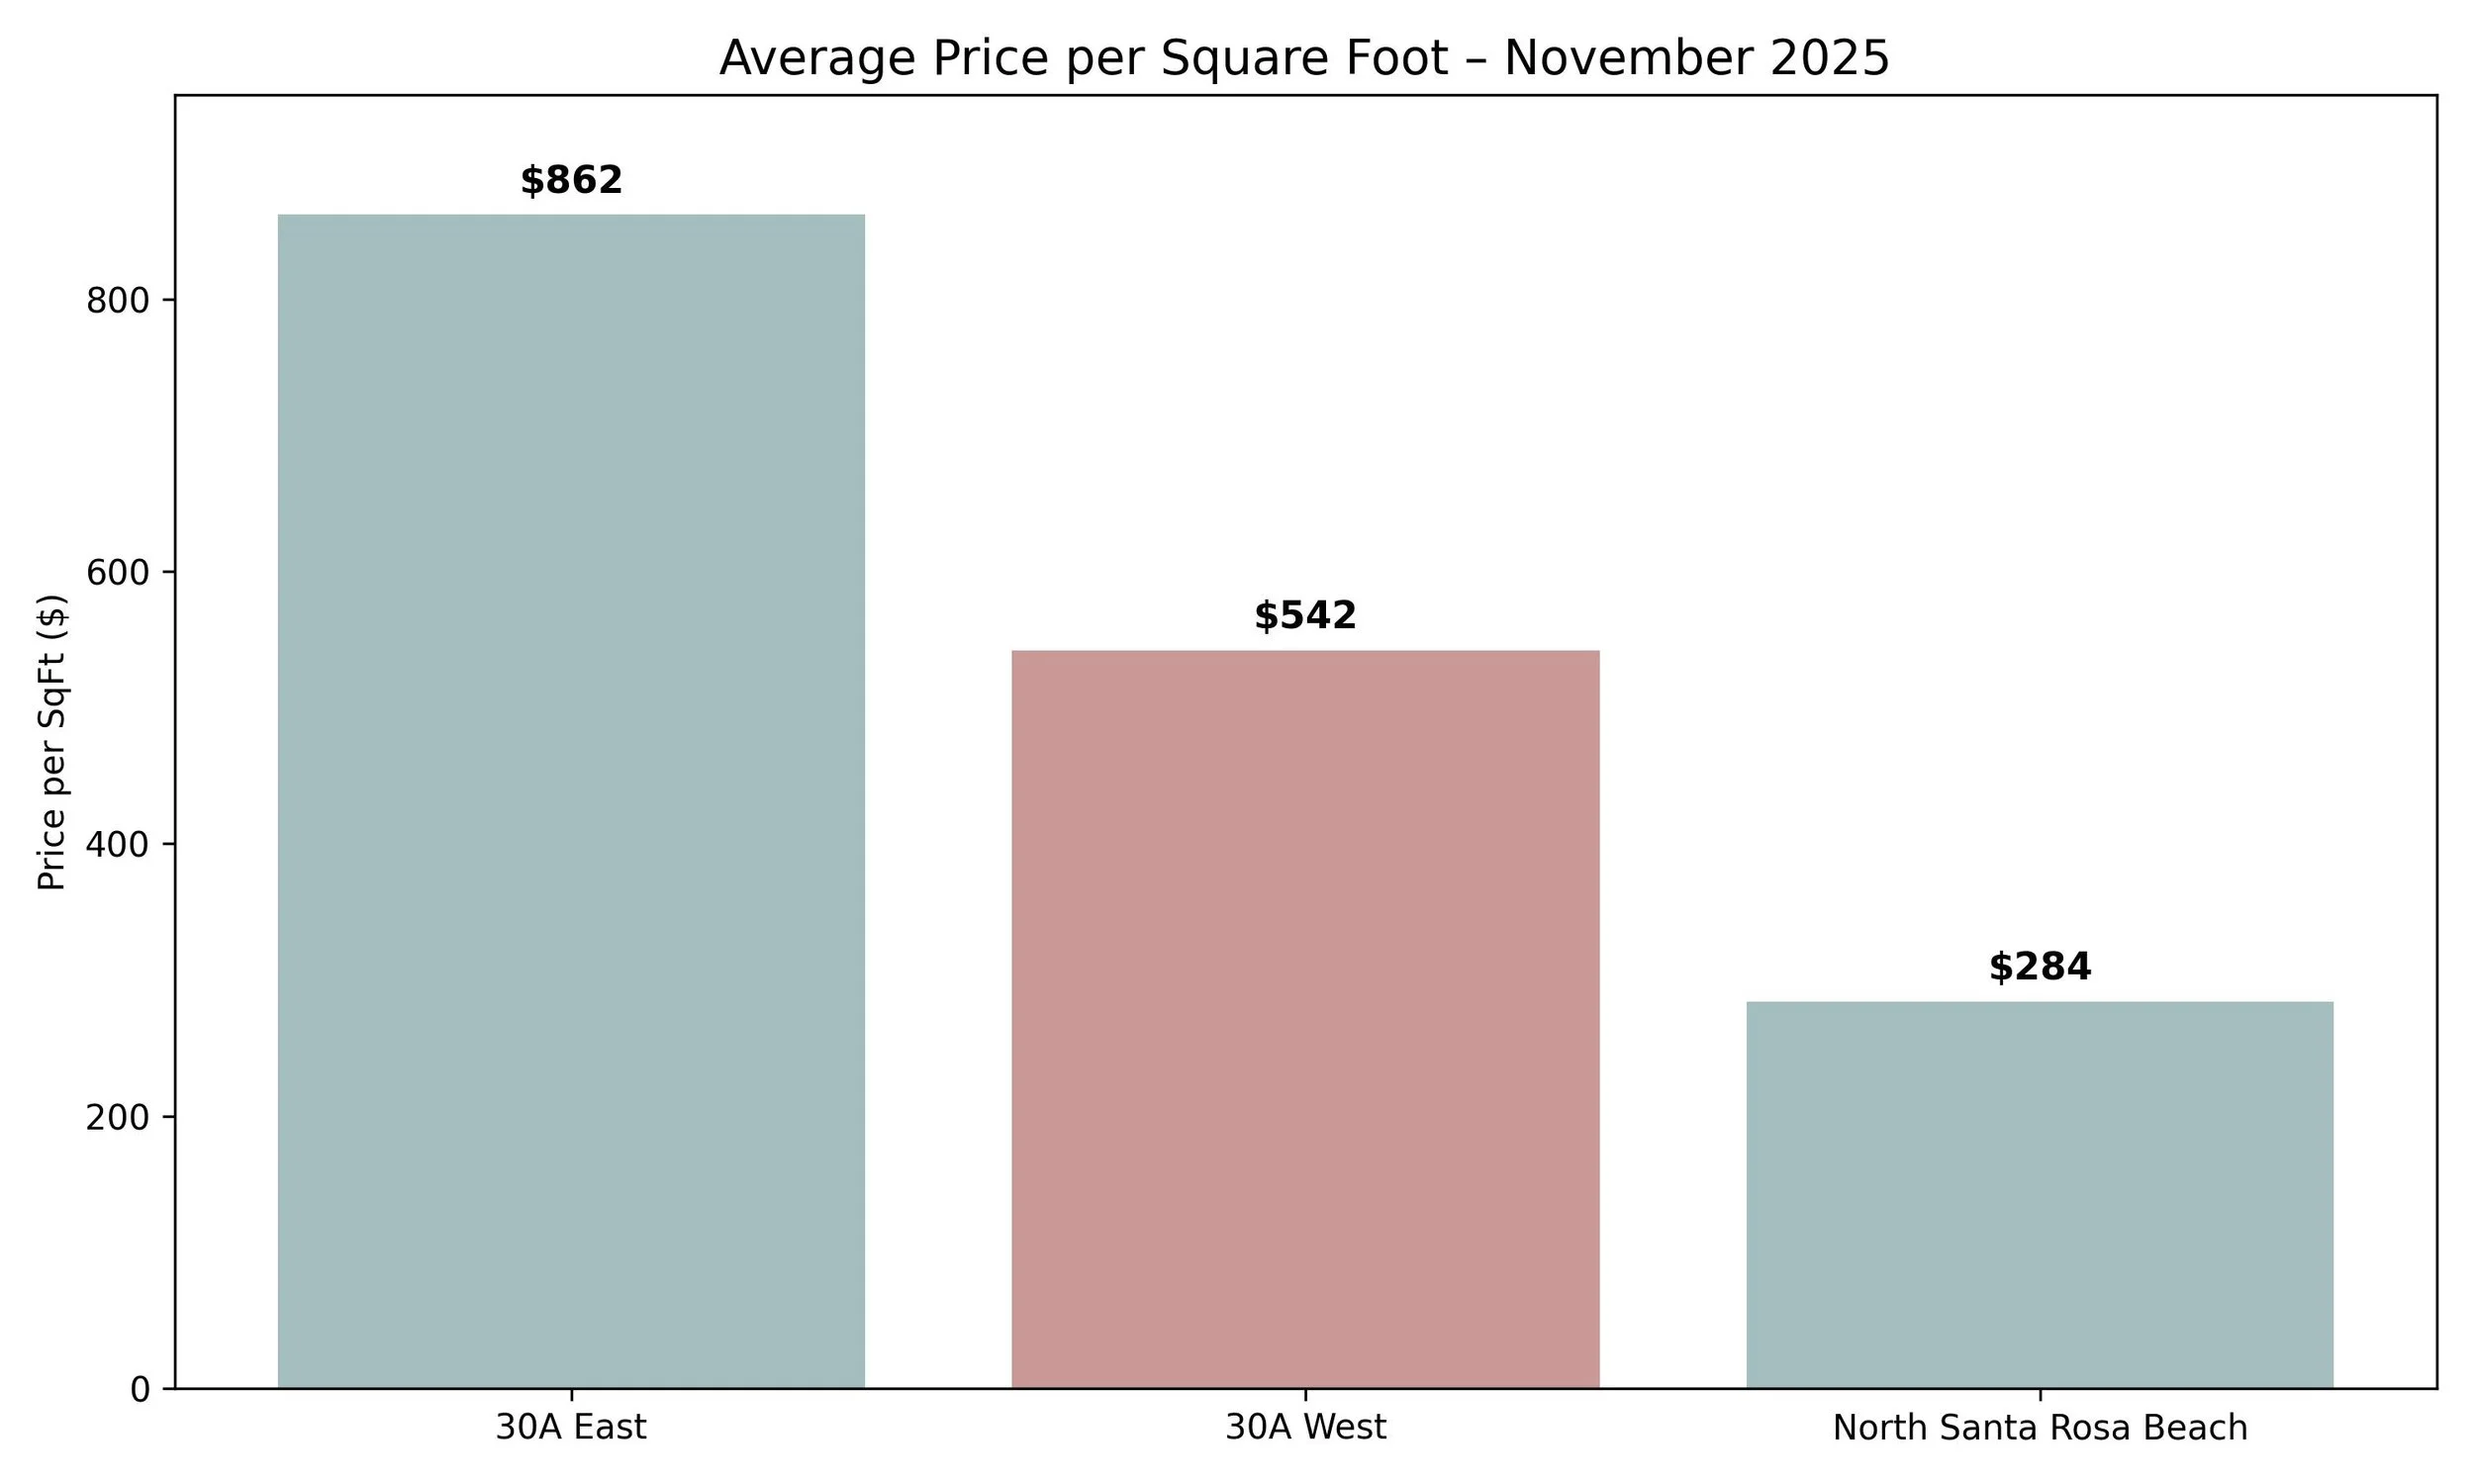
Average Price Per Sq Ft: $862
Average Sold Price: $2,291,000
Median Sold Price: $1,650,000
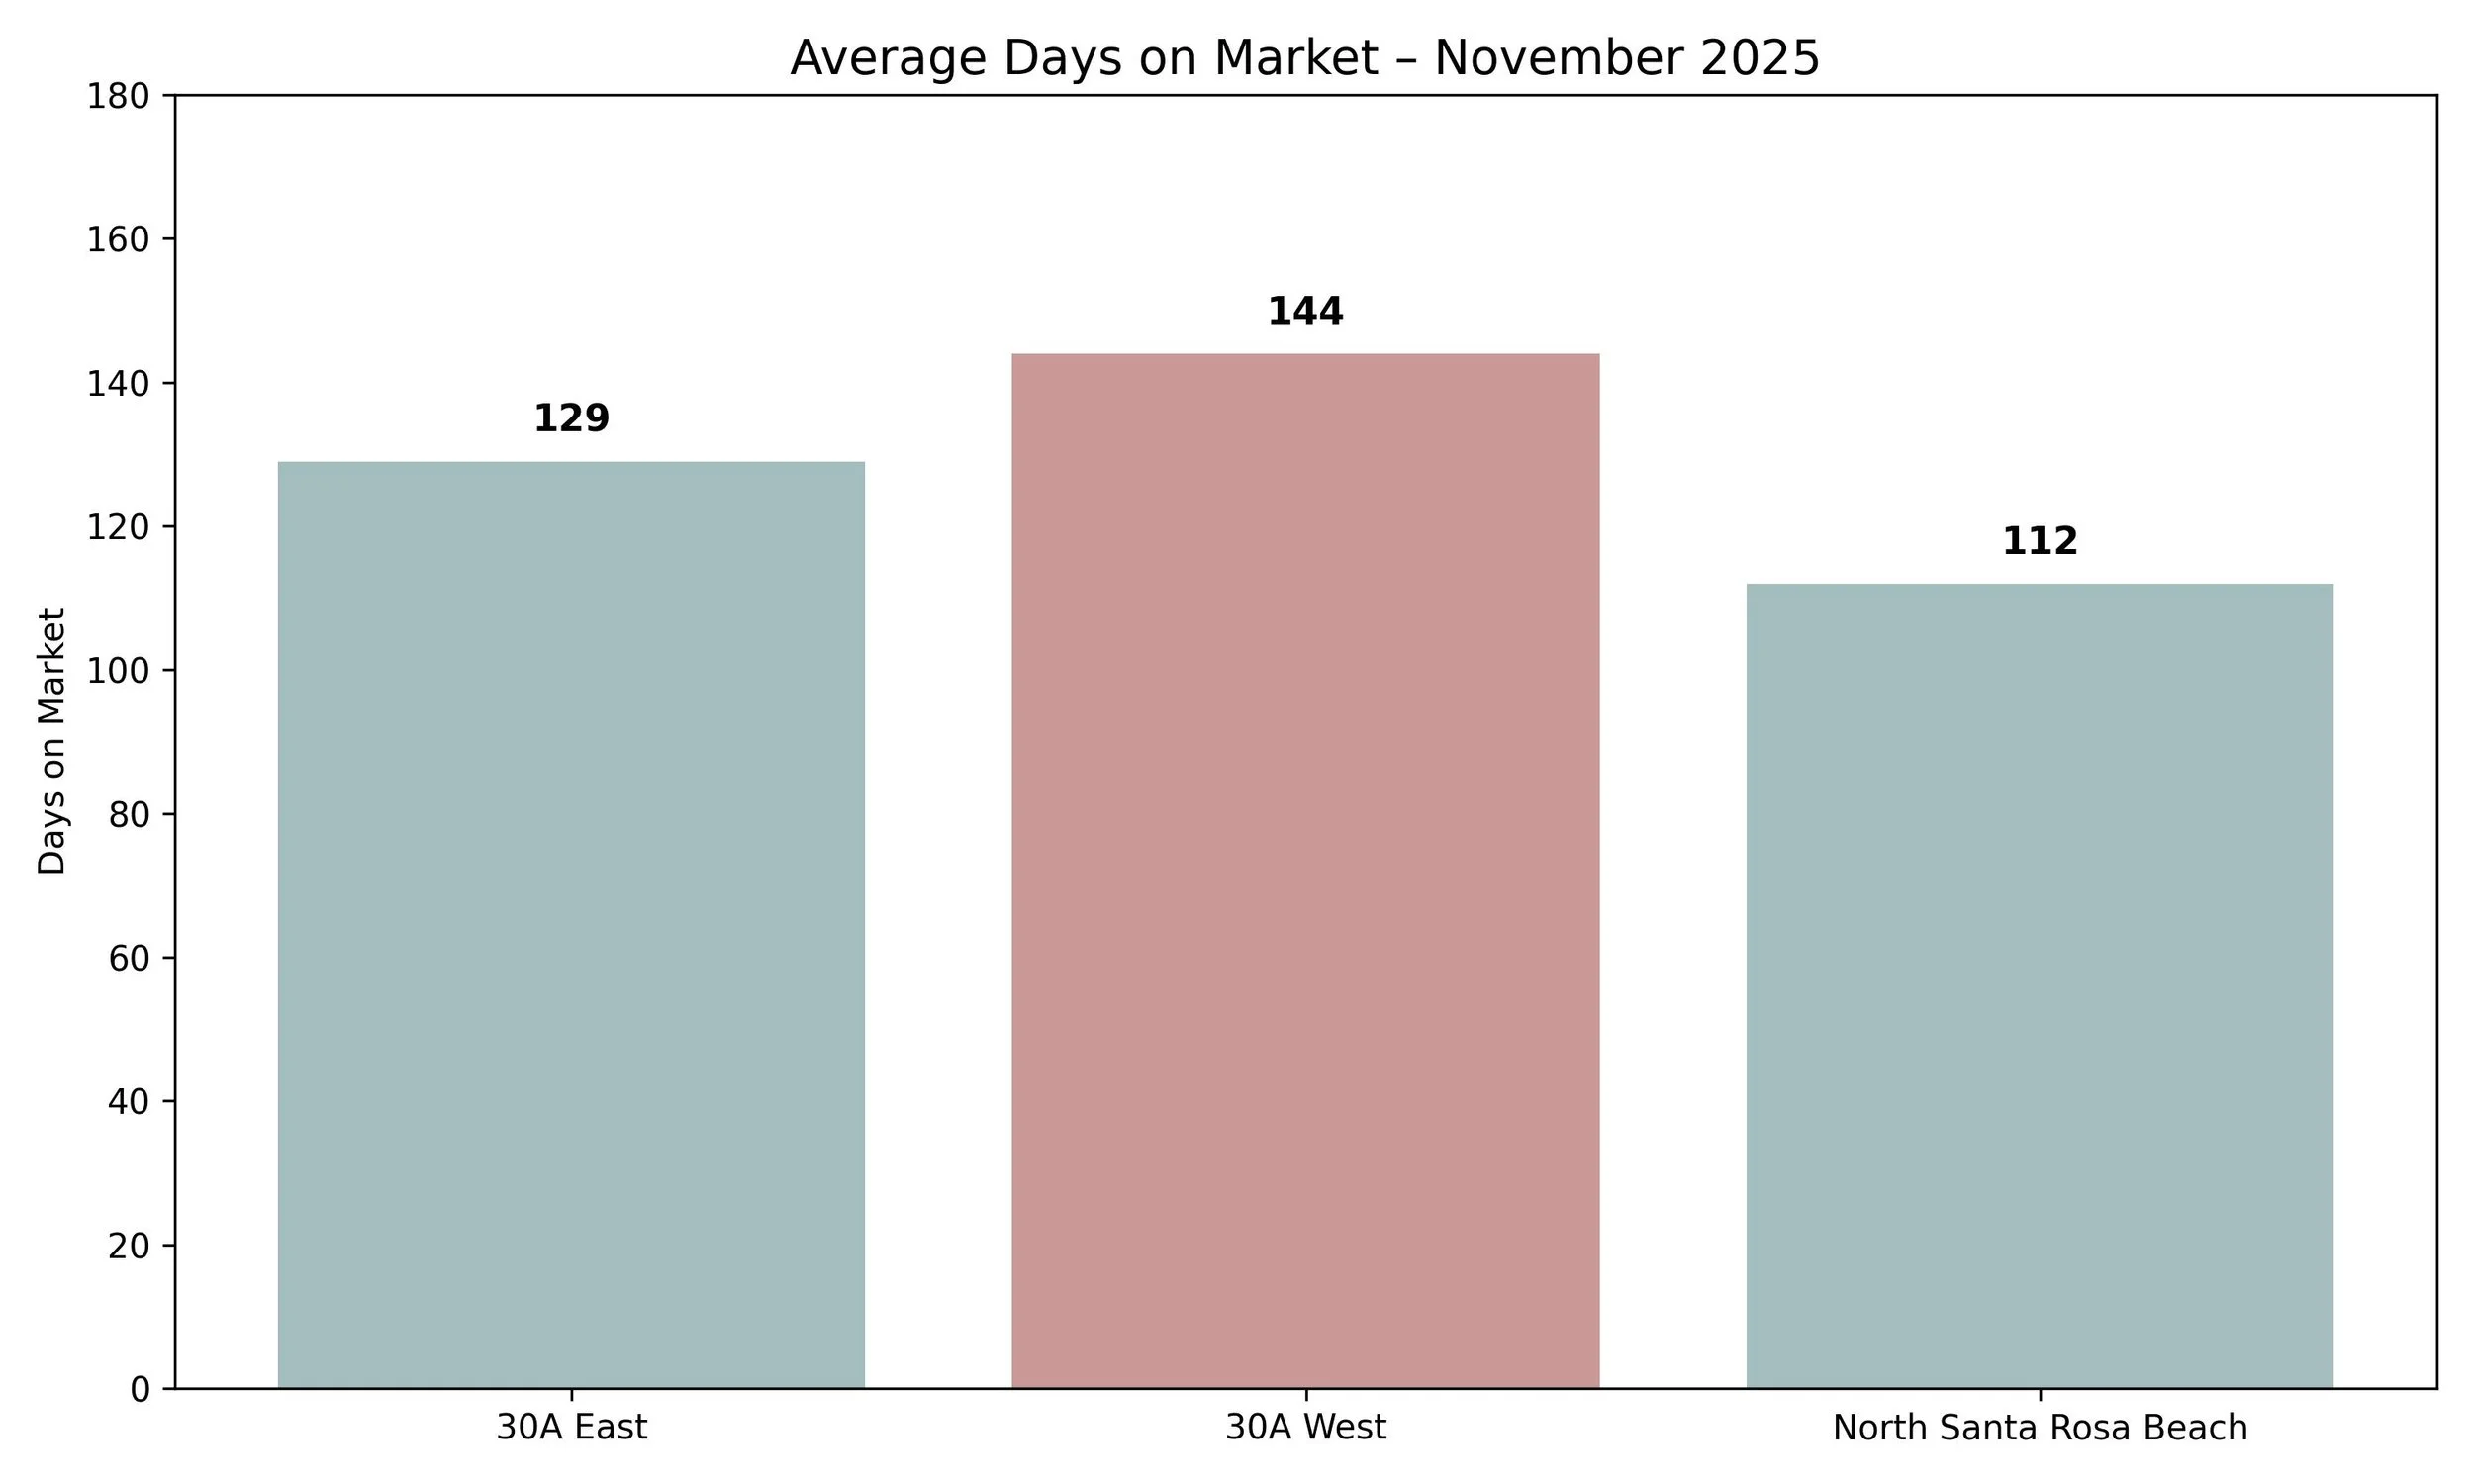
Average Days on Market: 129 days
Sold to List Price Ratio: 91%
What It Means:
Sales activity increased year over year, but homes are still taking longer to sell and closing below original list price. While the median and average prices jumped from October, both remain lower than last year, which tells us this is more about deal flow than appreciation.
30A West
Months of Inventory (Closed Sales): 19.1 months
Average Price Per Sq Ft: $542
Average Sold Price: $1,261,000
Median Sold Price: $1,036,000
Average Days on Market: 144 days
Sold to List Price Ratio: 90%
What It Means:
30A West continues to be the slowest moving segment of the market. Inventory is extremely high, absorption is low, and pricing pressure is very real. Even though average list prices are rising, sold prices are moving in the opposite direction.
North Santa Rosa Beach
Months of Inventory (Closed Sales): 13.6 months
Average Price Per Sq Ft: $284
Average Sold Price: $617,000
Median Sold Price: $516,000
Average Days on Market: 112 days
Sold to List Price Ratio: 96%
What It Means:
This area saw fewer sales but a sharp increase in homes going under contract, which is an early sign of buyer activity returning at the right price points. While pricing dropped significantly from October, sellers are holding closer to list price compared to other areas.
Allison’s Advice for Buyers
Buyers continue to hold the advantage along 30A as we move through late fall, with inventory sitting well above balanced levels in every major submarket. Months of supply ranges from roughly 9 months on the low end in 30A East to well over a year in 30A West. That kind of supply creates breathing room, more options, and real negotiating power.
That said, not all listings are equal. Homes that are updated, thoughtfully furnished, and located near beach access or town centers are still the first to attract attention. Even in a slower market, turnkey properties stand out quickly, especially those that check the right lifestyle and rental boxes.
Strategy matters. Buyers should pay close attention to days on market and price history. Listings that have lingered often signal flexibility, whether that comes in the form of price reductions, seller concessions, or favorable terms. At the same time, price per square foot trends show that values have softened year over year, reinforcing the importance of staying disciplined and data driven.
If short term rental income is part of the plan, dig deeper than the listing description. Pool setups, walkability, beach access quality, and overall visual appeal continue to be major drivers of performance. These details often separate homes that struggle from ones that book consistently.
Bottom line: Buyers have time, leverage, and choice right now. Just remember that the best opportunities are still the best homes. When one aligns with your goals and is priced correctly, hesitation can cost you.
Allison’s Advice for Sellers
For sellers, November reinforced a reality we have been seeing all year. This is a market that rewards precision, not optimism. Inventory remains elevated, days on market are long, and buyers are cautious, informed, and quick to compare options.
Pricing is the single biggest factor. Many sellers who started high are now chasing the market through reductions, often after missing their strongest window of exposure. Homes that are priced correctly from day one continue to outperform those that rely on eventual adjustments.
Presentation matters more than ever. Buyers are gravitating toward homes that feel turnkey, visually clean, and well maintained. Small issues that might have been overlooked in past years now stand out, especially when buyers have dozens of alternatives at similar price points.
Sellers should also be realistic about negotiation. Sold to list price ratios across much of 30A remain below 95 percent, with some areas closer to 90 percent. Buyers expect room to negotiate, and resisting that reality can extend time on market unnecessarily.
Bottom line: Homes that are priced right, fully prepared, and positioned clearly within the market are still selling. Those anchored to past peak pricing are simply waiting. In this environment, strategy and execution matter more than timing.
Looking Ahead: As we move into the winter months, the market enters a quieter but telling phase. We are watching closely to see how many of the homes currently under contract actually make it to the closing table, which will give us a clearer signal on buyer confidence heading into the new year.
Pricing behavior after the holidays will be another key indicator. Sellers who remain on the market into late winter may become more flexible, especially if their homes have already gone through multiple reductions. Historically, this period often reveals who is truly motivated versus who is willing to wait.
We are also keeping an eye on early Q1 activity. A return of serious buyers sooner than expected would suggest that pent up demand is still there, just waiting for the right combination of price and value.
The opportunity window is still open. Success in this market is less about trying to time the bottom and more about having a clear strategy, solid data, and the ability to act decisively when the right opportunity presents itself.
Want to Talk Strategy? Allison Freeman, 30A Realtor, can help you navigate this market confidently. Call me at 501.425.7656!